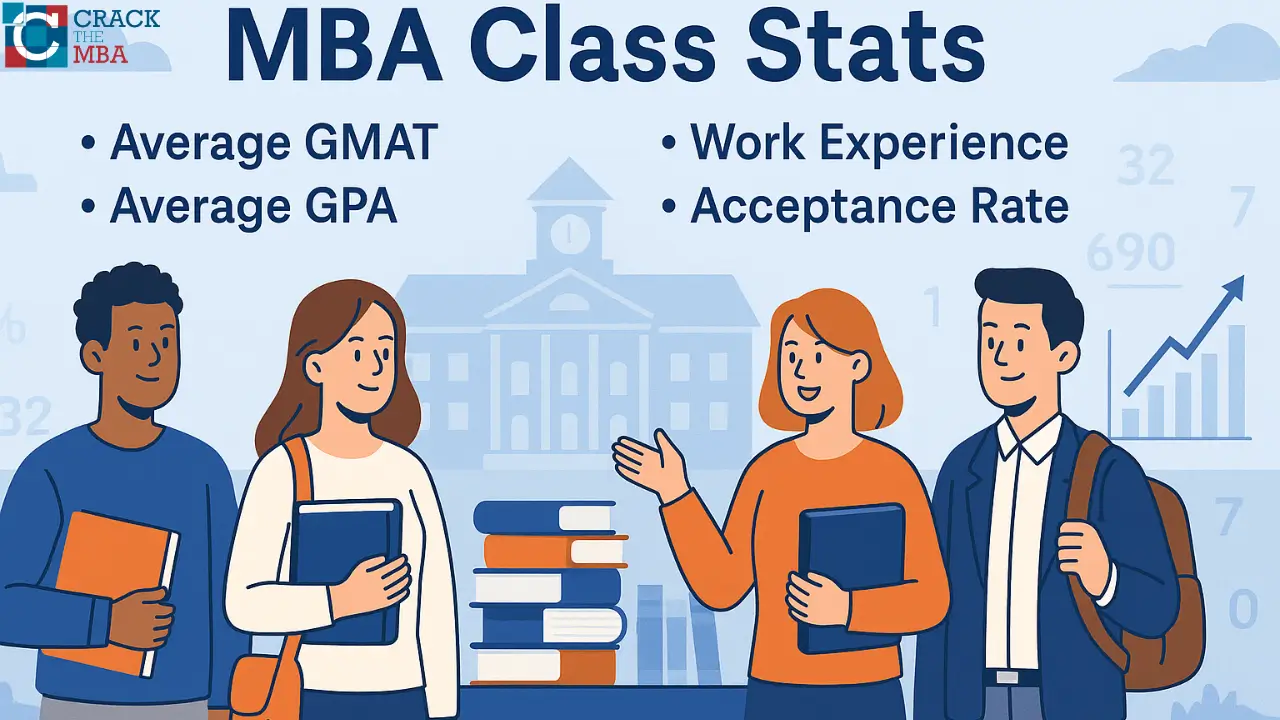
MBA Class Profile Stats: Average GMAT, GPA, Age, Work Experience, Yield Rates & Acceptance Rates
Applying to a top MBA program is as much about understanding yourself as it is about understanding the schools you’re applying to. While your story, goals, and fit with the program are critical, the numbers — average GMAT scores, GPAs, age, work experience, acceptance rates, and yield — provide a useful benchmark.
These statistics help you gauge where you stand relative to successful applicants and give insight into what each school values. A high average GMAT or GPA signals academic rigor, while a higher average work experience reflects a preference for mature, seasoned professionals. Acceptance rates reveal competitiveness, while yield rates hint at a school’s attractiveness to admitted students.
In this article, we’ll break down the latest data from top MBA programs in the US and beyond, giving you a clear picture of the profiles and outcomes at these schools — and helping you plan your application strategy effectively.
Average GMAT Scores at Top MBA Programs
The GMAT remains one of the most important quantitative indicators in your MBA application. While it’s not the only factor, the average GMAT at a school reflects its academic standards and competitiveness.
Here are the most recent average GMAT scores at top business schools:
| Business School | Average GMAT |
|---|---|
| Stanford GSB | 738 |
| Wharton (UPenn) | 733 |
| Chicago Booth | 732 |
| Northwestern Kellogg | 730 |
| Harvard Business School | 730 |
| MIT Sloan | 730 |
| UC Berkeley Haas | 729 |
| Columbia Business School | 729 |
| Dartmouth Tuck | 726 |
| Yale SOM | 725 |
| NYU Stern | 723 |
| Michigan Ross | 720 |
| Duke Fuqua | 713 |
| UVA Darden | 715 |
| UCLA Anderson | 716 |
| Cornell Johnson | 710 |
| UNC Kenan-Flagler | 696 |
| CMU Tepper | 705 |
| Georgetown McDonough | 691 |
| Indiana Kelley | 667 |
| Texas McCombs | 704 |
| Emory Goizueta | 700 |
| Washington Foster | 704 |
| Vanderbilt Owen | 680 |
| USC Marshall | 716 |
| Rice Jones | 702 |
| Minnesota Carlson | 690 |
| Notre Dame Mendoza | 687 |
| Washington Olin (St. Louis) | 685 |
| Boston University Questrom | 683 |
| Rochester Simon | 667 |
| UC Irvine Merage | 665 |
| Maryland Smith | 640 |
You can see that even beyond the M7, many schools expect a competitive GMAT score in the 680–720 range. At the very top (Stanford, Wharton, Booth), averages approach or exceed 730, reflecting their highly competitive applicant pools.
Average GPA of Incoming Classes
Undergraduate GPA gives business schools a sense of your academic consistency and ability to handle a rigorous curriculum. While GPA standards vary based on grading systems and applicant demographics, these averages reflect the high caliber of admitted students.
Here are the most recent average undergraduate GPAs at top MBA programs:
| Business School | Average GPA |
|---|---|
| Stanford GSB | 3.77 |
| Harvard Business School | 3.70 |
| Wharton (UPenn) | 3.60 |
| Chicago Booth | 3.60 |
| MIT Sloan | 3.60 |
| Northwestern Kellogg | 3.60 |
| UC Berkeley Haas | 3.65 |
| Columbia Business School | 3.50 |
| Dartmouth Tuck | 3.54 |
| Yale SOM | 3.65 |
| NYU Stern | 3.50 |
| Michigan Ross | 3.50 |
| Duke Fuqua | 3.50 |
| UVA Darden | 3.50 |
| UCLA Anderson | 3.50 |
| Cornell Johnson | 3.40 |
| CMU Tepper | 3.30 |
| UNC Kenan-Flagler | 3.40 |
| Georgetown McDonough | 3.30 |
| Indiana Kelley | 3.30 |
| Texas McCombs | 3.48 |
| Emory Goizueta | 3.30 |
| Washington Foster | 3.40 |
| Vanderbilt Owen | 3.30 |
| Rice Jones | 3.40 |
| Notre Dame Mendoza | 3.30 |
| USC Marshall | 3.50 |
| Minnesota Carlson | 3.30 |
| Washington Olin (St. Louis) | 3.30 |
| Boston University Questrom | 3.30 |
| Rochester Simon | 3.30 |
| UC Irvine Merage | 3.20 |
| Maryland Smith | 3.20 |
While top-tier programs often report GPAs above 3.6, it’s important to remember that they consider your overall academic context — your major, school, and trajectory — not just the number.
Average Age & Work Experience
Top MBA programs value maturity, professional experience, and demonstrated leadership potential, which is why successful candidates usually have several years of work experience before applying.
Here are the most recent averages for age and full-time work experience at leading MBA programs:
| Business School | Average Age | Average Work Experience (years) |
|---|---|---|
| Stanford GSB | 28 | 4.7 |
| Harvard Business School | 27 | 4.5 |
| Wharton (UPenn) | 28 | 5 |
| Chicago Booth | 28 | 5 |
| Northwestern Kellogg | 28 | 5 |
| MIT Sloan | 28 | 5 |
| UC Berkeley Haas | 28 | 5 |
| Columbia Business School | 28 | 5 |
| Dartmouth Tuck | 28 | 5 |
| Yale SOM | 28 | 4.5–5 |
| NYU Stern | 28 | 5 |
| Michigan Ross | 28 | 5 |
| Duke Fuqua | 29 | 5.6 |
| UVA Darden | 27 | 5 |
| UCLA Anderson | 28 | 5 |
| Cornell Johnson | 28 | 5 |
| CMU Tepper | 29 | 5.5 |
| UNC Kenan-Flagler | 28 | 5–5.5 |
| Georgetown McDonough | 28 | 5 |
| Indiana Kelley | 29 | 5–6 |
| Texas McCombs | 28 | 5 |
| Emory Goizueta | 28 | 5 |
| Washington Foster | 29 | 6 |
| Vanderbilt Owen | 28 | 5 |
| Rice Jones | 28 | 5 |
| Notre Dame Mendoza | 29 | 5 |
| USC Marshall | 28 | 5 |
Observations:
- Most top programs enroll students in their late 20s, with ~4–6 years of experience.
- Some programs (like Fuqua, Foster, Kelley) lean slightly older and value deeper experience.
- Programs also welcome younger and slightly older applicants if their profiles are exceptional.
Acceptance Rates at Top Business Schools
Acceptance rates reflect how competitive a program is, though they also depend on the size of the applicant pool, class size, and how many people apply each year.
Below are the most recent published acceptance rates at leading MBA programs:
| Business School | Acceptance Rate (%) |
|---|---|
| Stanford GSB | ~6% |
| Harvard Business School | ~12% |
| Wharton (UPenn) | ~14% |
| MIT Sloan | ~15% |
| Columbia Business School | ~15% |
| UC Berkeley Haas | ~14% |
| Chicago Booth | ~23% |
| Northwestern Kellogg | ~26% |
| Dartmouth Tuck | ~34% |
| Yale SOM | ~29% |
| NYU Stern | ~27% |
| Michigan Ross | ~28% |
| Duke Fuqua | ~20% |
| UVA Darden | ~26% |
| UCLA Anderson | ~28% |
| Cornell Johnson | ~40% |
| CMU Tepper | ~40% |
| UNC Kenan-Flagler | ~44% |
| Georgetown McDonough | ~55% |
| Indiana Kelley | ~40–45% |
| Texas McCombs | ~35–38% |
| Emory Goizueta | ~37% |
| Washington Foster | ~35–40% |
| Vanderbilt Owen | ~50% |
| Rice Jones | ~39% |
| Notre Dame Mendoza | ~45–50% |
| USC Marshall | ~28% |
Observations:
- Stanford remains the most selective MBA program globally, with an acceptance rate under 7%.
- Other M7 schools (HBS, Wharton, Sloan, Kellogg, Booth, Columbia) all range between 12–26%.
- Many excellent programs outside the M7 have rates between 25–45%, still highly competitive.
Yield Rates at Top Business Schools
Yield rate — the percentage of admitted students who actually enroll — indicates how strongly applicants prefer a particular program. A higher yield often reflects a school’s prestige, culture, and perceived ROI.
Here are the most recent yield rates for leading MBA programs:
| Business School | Yield Rate (%) |
|---|---|
| Stanford GSB | ~83% |
| Harvard Business School | ~81% |
| Wharton (UPenn) | ~61% |
| Chicago Booth | ~58% |
| Northwestern Kellogg | ~56% |
| MIT Sloan | ~59% |
| Columbia Business School | ~48% |
| UC Berkeley Haas | ~48% |
| Dartmouth Tuck | ~54% |
| Yale SOM | ~43% |
| NYU Stern | ~45% |
| Michigan Ross | ~44% |
| Duke Fuqua | ~47% |
| UVA Darden | ~45% |
| UCLA Anderson | ~41% |
| Cornell Johnson | ~44% |
| CMU Tepper | ~40% |
| UNC Kenan-Flagler | ~37% |
| Georgetown McDonough | ~36% |
| Indiana Kelley | ~38% |
| Texas McCombs | ~42% |
| Emory Goizueta | ~40% |
| Washington Foster | ~38% |
| Vanderbilt Owen | ~35% |
| Rice Jones | ~37% |
| Notre Dame Mendoza | ~38% |
| USC Marshall | ~40% |
Observations:
- Stanford and Harvard dominate with yields above 80%, indicating they’re the first choice for the vast majority of admitted students.
- M7 schools generally enjoy higher yields than others.
- Yield also reflects financial aid generosity, geographic preference, and brand strength.
Final Thoughts
Understanding the numbers behind top MBA programs’ average GMAT scores, GPA, age, work experience, acceptance rates, and yield gives you a valuable perspective on what these schools look for and how competitive they are.
While these statistics are helpful benchmarks, they tell only part of the story. Many successful applicants have profiles below the averages in one area but shine in others, through leadership, unique experiences, impactful work, or exceptional essays and interviews.
Use this data to guide your preparation and set realistic expectations, but remember: admissions committees care about who you are, not just your numbers. Focus on crafting a compelling narrative that highlights your strengths, aligns with the school’s culture, and demonstrates your potential to contribute to their community.
With thoughtful planning and a clear strategy, you can put together an application that stands out, even in the most competitive applicant pools.

")


